はじめに
以前の記事でマンデルブロ集合の図形はいろんな箇所を拡大すれば様々な形が現れておもしろいですよという話をしました。
mori-memo.hateblo.jp
上の記事で書いたコードでもがんばれば探索できますが、拡大したい箇所の座標をいちいち探して、コード変えて実行しなおしてというのはなかなか骨が折れます。
そこで、今までやってきたmatplotlibのマウスイベントを使ってmatplotlibのみでインタラクティブにマンデルブロ集合を探索できるようにしてみましょう。
マウスでクリックした箇所を好きな倍率で拡大して再描画できるようにします。
この記事でできる最終的な実行結果は下記のようになります。計算にすごく時間がかかるので、解像度を落として計算スピードを上げてます。

それでは実装していきましょう!
機能まとめ
必要な機能は以下の通りです。
- 対象範囲でマンデルブロ集合の描画
- マウスカーソルを中心に探索したい範囲を四角で表示
- マウスホイール操作で探索したい範囲の拡大縮小を行う
- マウスクリックで上記の四角のエリアで再判定⇒グラフ再描画
順番に説明します。
マンデルブロ集合の描画
以前の記事とほとんど同じですので説明は割愛します。
mori-memo.hateblo.jp
import numpy as np
import matplotlib.pyplot as plt
from matplotlib.patches import Rectangle

def mandelbrot(n, comp):
    c = complex(comp[0], comp[1])
    z = complex(0, 0)
    for i in range(n):
        z = z*z + c
        #zの絶対値が一度でも2を超えればzが発散すると判定
        if abs(z) >= 2:
            return i

    return n     #無限大に発散しない場合にはnを返す

def calc_mand(x_c, y_c, width, resolution, n):
    height = width * 9 / 16
    xres = resolution * 16 // 25
    yres = resolution * 9 // 25
    x = np.linspace(x_c - width / 2, x_c + width / 2, xres)
    y = np.linspace(y_c - height / 2, y_c + height / 2, yres)
    #実部と虚部の組み合わせを作成
    X, Y = np.meshgrid(x, y)
    mesh = np.zeros(len(X.ravel()))
    for i, comp in enumerate(zip(X.ravel(), Y.ravel())):
        mesh[i] = mandelbrot(n, comp)
    mesh = mesh.reshape((yres, xres))
    return mesh

x_init = 0
y_init = 0
width_init = 4.4
height_init = width_init * 9 / 16
extent_init = (x_init - width_init, x_init + width_init,
               y_init - height_init, y_init + height_init)
resolution = 1000
iter_num = 100

mesh = calc_mand(x_init, y_init, width_init, resolution, iter_num)
fig, ax = plt.subplots(dpi=600)
im = ax.imshow(mesh, cmap="jet", origin='lower', extent=extent_init)
ax.axis('off')
plt.show()

マウスカーソルの四角を表示、スクロールでカーソルの拡大縮小
前に四角をマウス操作で好き勝手描画する方法について説明しておりましたが、そこで使った方法をそのまま使用します
mori-memo.hateblo.jp
def motion(event):
    global width, height
    # マウスが範囲外の時はカーソル(四角)を非表示
    if event.xdata == None or event.ydata == None:
        rect.set_xy((np.nan, np.nan))
        plt.draw()
        return

    # Rectangleのxyは左下の座標なので、マウスを中心に四角を描けるよう計算
    x = event.xdata - width / 2
    y = event.ydata - height / 2
    cur.set_xy((x, y))
    cur.set_width(width)
    cur.set_height(height)

    # タイトルに現在の縦横サイズを表示
    ax.set_title('width = {}, height = {}'.format(round(width, 8), round(height, 8)), fontsize=4)

    # グラフを更新
    plt.draw()

def scroll(event):
    global width, zoom, height
    width *= zoom**(event.step)
    height *= zoom**(event.step)

width = 4.4 / 2   # カーソルの幅
height = width * 9 / 16   # カーソルの高さ
zoom = 1.5
x_init = 0
y_init = 0
width_init = 4.4
height_init = width_init * 9 / 16
extent_init = (x_init - width_init, x_init + width_init,
               y_init - height_init, y_init + height_init)
resolution = 1000
iter_num = 100

mesh = calc_mand(x_init, y_init, width_init, resolution, iter_num)
fig, ax = plt.subplots(dpi=600)
im = ax.imshow(mesh, cmap="jet", origin='lower', extent=extent_init)
rect = Rectangle(xy=(np.nan, np.nan), width=width, height=height, ec='k', fill=False)
cur = ax.add_patch(rect)
ax.axis('off')

fig.canvas.mpl_connect('motion_notify_event', motion)
# 四角のカーソルを表示、マウスに追従
fig.canvas.mpl_connect('scroll_event', scroll)
# 四角のカーソルをホイールで拡大、縮小
plt.show()
ここまでの実行結果は下記です。

マウスクリックでカーソルのエリアを再計算、再描画
on_click関数を作り、figure と紐づけます。
紐づけ:
fig.canvas.mpl_connect('button_press_event', onclick)
on_click関数:
def onclick(event):
    global width, height
    # 範囲外クリック無効
    if event.xdata == None or event.ydata == None:
        return

    # Rectangleのxyは左下の座標なので、マウスを中心に四角を描けるよう計算
    x = event.xdata
    y = event.ydata
    mesh = calc_mand(x, y, width, resolution, iter_num)
    im.set_data(mesh)
    im.set_extent([x - width / 2, x + width / 2, y - height / 2, y + height / 2])
    im.autoscale()
    plt.draw()
クリックされると、現在のカーソルのエリア内で再計算し、その計算結果である行列データをset_data()メソッドでプロットデータを上書きしています。
x軸、y軸をカーソルのエリアの範囲に変更するためにset_extent()メソッドでimshowの軸を更新しています。
最後にautoscale()でカラーバーを更新しています。
imshowの使い方については過去記事を参考ください。
mori-memo.hateblo.jp
全コード
最後に全コード載せておきます。
import numpy as np
import matplotlib.pyplot as plt
from matplotlib.patches import Rectangle

def mandelbrot(n, comp):
    c = complex(comp[0], comp[1])
    z = complex(0, 0)
    for i in range(n):
        z = z*z + c
        #zの絶対値が一度でも2を超えればzが発散すると判定
        if abs(z) >= 2:
            return i

    return n     #無限大に発散しない場合にはnを返す

def calc_mand(x_c, y_c, width, resolution, n):
    height = width * 9 / 16
    xres = resolution * 16 // 25
    yres = resolution * 9 // 25
    x = np.linspace(x_c - width / 2, x_c + width / 2, xres)
    y = np.linspace(y_c - height / 2, y_c + height / 2, yres)
    #実部と虚部の組み合わせを作成
    X, Y = np.meshgrid(x, y)
    mesh = np.zeros(len(X.ravel()))
    for i, comp in enumerate(zip(X.ravel(), Y.ravel())):
        mesh[i] = mandelbrot(n, comp)
    mesh = mesh.reshape((yres, xres))
    return mesh

def motion(event):
    global width, height
    # マウスが範囲外の時はカーソル(四角)を非表示
    if event.xdata == None or event.ydata == None:
        rect.set_xy((np.nan, np.nan))
        plt.draw()
        return

    # Rectangleのxyは左下の座標なので、マウスを中心に四角を描けるよう計算
    x = event.xdata - width / 2
    y = event.ydata - height / 2
    cur.set_xy((x, y))
    cur.set_width(width)
    cur.set_height(height)

    # タイトルに現在の縦横サイズを表示
    ax.set_title('width = {}, height = {}'.format(round(width, 8), round(height, 8)), fontsize=4)

    # グラフを更新
    plt.draw()

def scroll(event):
    global width, zoom, height
    width *= zoom**(event.step)
    height *= zoom**(event.step)

def onclick(event):
    global width, height
    # 範囲外クリック無効
    if event.xdata == None or event.ydata == None:
        return

    # Rectangleのxyは左下の座標なので、マウスを中心に四角を描けるよう計算
    x = event.xdata
    y = event.ydata
    mesh = calc_mand(x, y, width, resolution, iter_num)
    im.set_data(mesh)
    im.set_extent([x - width / 2, x + width / 2, y - height / 2, y + height / 2])
    im.autoscale()
    plt.draw()

width = 4.4 / 2   # カーソルの幅
height = width * 9 / 16   # カーソルの高さ
zoom = 1.5
x_init = 0
y_init = 0
width_init = 4.4
height_init = width_init * 9 / 16
extent_init = (x_init - width_init, x_init + width_init,
               y_init - height_init, y_init + height_init)
resolution = 1000
iter_num = 100

mesh = calc_mand(x_init, y_init, width_init, resolution, iter_num)
fig, ax = plt.subplots(dpi=600)
im = ax.imshow(mesh, cmap="jet", origin='lower', extent=extent_init)
rect = Rectangle(xy=(np.nan, np.nan), width=width, height=height, ec='k', fill=False)
cur = ax.add_patch(rect)
ax.axis('off')
fig.canvas.mpl_connect('button_press_event', onclick)
fig.canvas.mpl_connect('motion_notify_event', motion)
fig.canvas.mpl_connect('scroll_event', scroll)
plt.show()
おわりに
今回はgif動画にする関係上、解像度とマンデルブロ集合判定の繰り返し回数を小さめにしましたが、大きくしてみると面白い図形が見られるかもしれません。
いろいろ試してみてください。
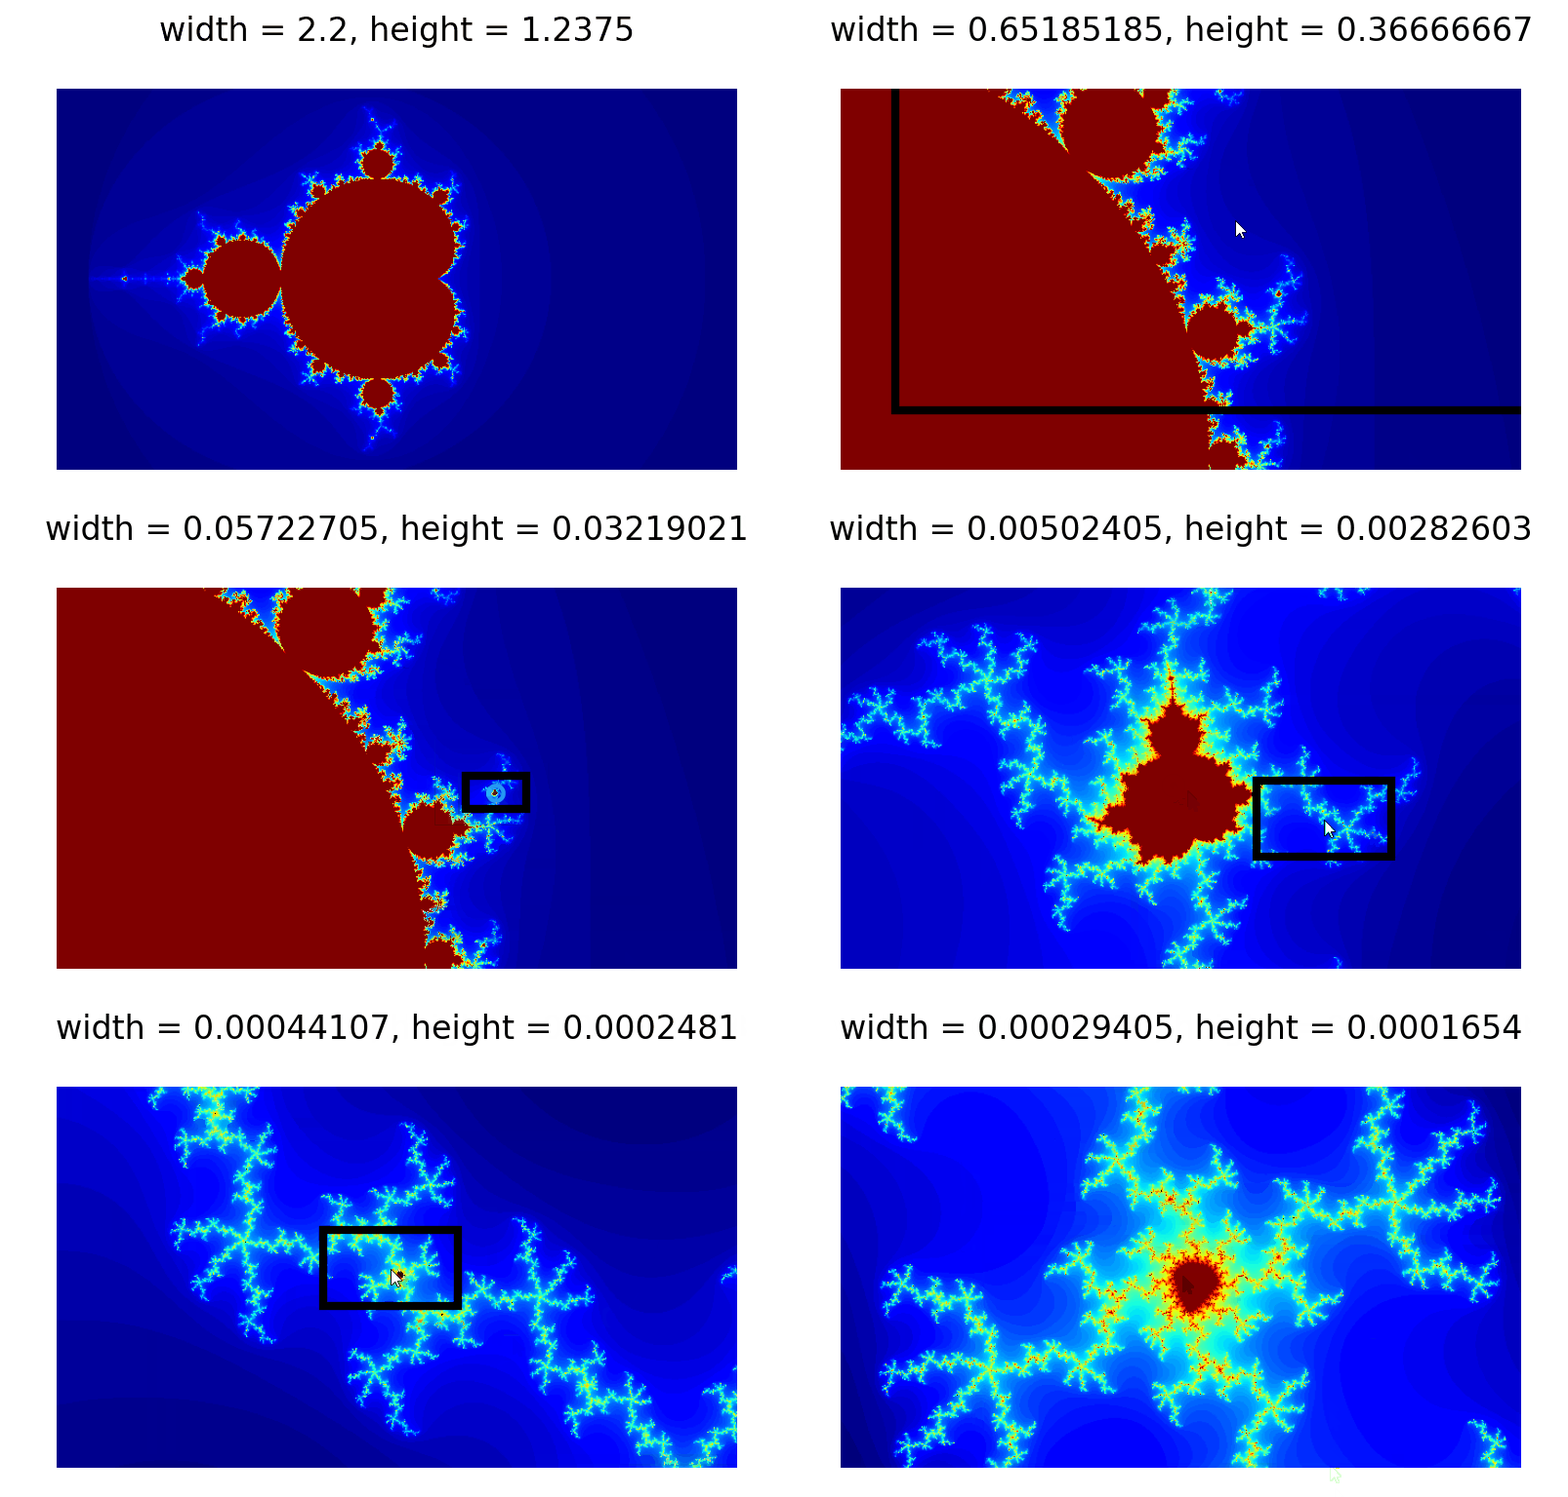
私が見つけられたのはこんな感じの図形でした。
