はじめに
今回はマウスのスクロールイベントとmatplotlibのグラフを紐づけてグラフを操作できるようにしたいと思います。
今回はサンプルとして以下のものを作ってみたいと思います。

使い道はいまいち考えてません(わかりません!)が、グラフ内にクリックで四角を描画するプログラムです。
描く四角はマウスのスクロールで拡大、縮小させます。
右クリックで縦横比交換します。
スクロールイベントの紐づけ
「マウスでスクロールする」という'scroll_event'をグラフに紐づけます。
'scroll_event'ではevent.stepというクラス変数を使うことができ、上に1ステップスクロールすると+1、下に1ステップスクロールすると-1が入力されます。
これを使って拡大、縮小を実装してみたいと思います。
コード実装
四角をプロットする方法
四角をプロットする際はmatplotlibのRectangleクラスを使用するのが便利です。
import matplotlib.pyplot as plt
import numpy as np
from matplotlib.patches import Rectangle

fig, ax = plt.subplots()
width = 0.02
height = 0.01
rect = Rectangle(xy=(0.0, 0.0), width=width, height=height, ec='k', fill=False)
cur = ax.add_patch(rect)
ax.set_xlim([-0.05, 0.05])
ax.set_ylim([-0.05, 0.05])
plt.show()
出力:

Rectangleクラスではパラメータxyに四角の位置をタプル形式で与えます。ここで、xyは四角の左下の頂点の座標であることに注意が必要です。
クリックして四角をプロットできるようにする
過去記事を参考に、クリックして四角が描けるように変更します。
【python】matplotlibでマウスクリックイベントを紐づける - morikomorou’s blog
やってることはほとんど同じです。
直線の時はset_data()メソッドで値の更新を行いましたが、Rectangleクラスにはそのメソッドがないので、set_xy()メソッドで位置の更新を行います。
import matplotlib.pyplot as plt
import numpy as np
from matplotlib.patches import Rectangle

fig, ax = plt.subplots()
width = 0.02
height = 0.01
rect = Rectangle(xy=(np.nan, np.nan), width=width, height=height, ec='k', fill=False)
ax.set_xlim([-0.05, 0.05])
ax.set_ylim([-0.05, 0.05])
cur = ax.add_patch(rect)


def motion(event):
    global width, height
    # マウスが範囲外の時はカーソル(四角)を非表示
    if event.xdata == None or event.ydata == None:
        rect.set_xy((np.nan, np.nan))
        plt.draw()
        return

    # Rectangleのxyは左下の座標なので、マウスを中心に四角を描けるよう計算
    x = event.xdata - width / 2
    y = event.ydata - height / 2
    cur.set_xy((x, y))
    cur.set_width(width)
    cur.set_height(height)

    # タイトルに現在の縦横サイズを表示
    ax.set_title('width = {}, height = {}'.format(round(width, 3), round(height, 3)))

    # グラフを更新
    plt.draw()


def onclick(event):
    global width, height
    # 右クリックで縦横交換
    if event.button == 3:
        width, height = height, width
        return

    # 範囲外クリック無効
    if event.xdata == None or event.ydata == None:
        return

    # Rectangleのxyは左下の座標なので、マウスを中心に四角を描けるよう計算
    x = event.xdata - width / 2
    y = event.ydata - height / 2
    new_rect = Rectangle(xy=(x, y), width=width, height=height, ec='b', fill=False)
    ax.add_patch(new_rect)
    plt.draw()


fig.canvas.mpl_connect('button_press_event', onclick)
fig.canvas.mpl_connect('motion_notify_event', motion)
plt.show()
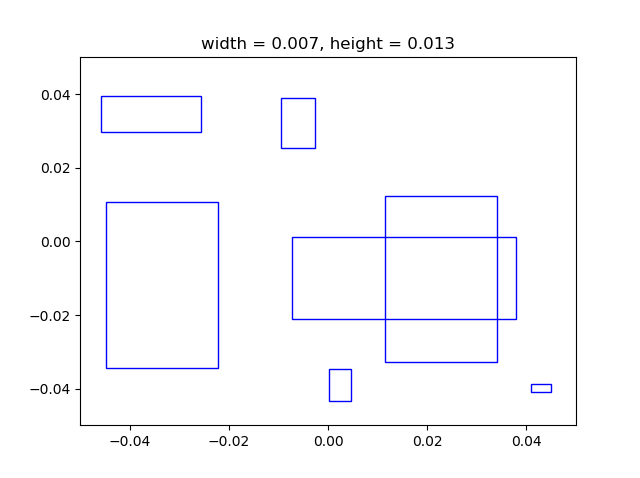
結果は以下の通りです。
もうほとんど形になってきました。
最終的にスクロールイベントと四角のwidth, heightの値を対応させて拡大縮小したいので、グローバル変数として呼び出して使用します。
あとは右クリックで縦横サイズ入れかえをしています。右クリックをした際は、event.buttonに3が入力として入るため、その値をトリガーに分岐処理しています。
描く四角のサイズをスクロールで変更
まず、スクロール関数を作り、figureとスクロールイベントを紐づけます。
fig.canvas.mpl_connect('scroll_event', scroll)
スクロール関数内は下記のように実装します。
def scroll(event):
    global width, zoom, height
    width *= zoom**(event.step)
    height *= zoom**(event.step)
zoomというグローバル変数または定数を用意しておきます。
今回はzoom=1.5としました。
一定角スクロールされるたびにこのscroll関数がよばれ、スクロールの方向によってevent.stepには+1(上) or -1(下)が入ります。
つまり、この関数では、一定角スクロールされるたびに、そのスクロール方向に応じでwidth及びheightを1.5倍(上) or 1/1.5倍(下)する処理を行います。
最後に全体のコードを載せておきます。
import matplotlib.pyplot as plt
import numpy as np
from matplotlib.patches import Rectangle

fig, ax = plt.subplots()
width = 0.02
height = 0.01
zoom = 1.5
rect = Rectangle(xy=(np.nan, np.nan), width=width, height=height, ec='k', fill=False)
ax.set_xlim([-0.05, 0.05])
ax.set_ylim([-0.05, 0.05])
cur = ax.add_patch(rect)

def motion(event):
    global width, height
    # マウスが範囲外の時はカーソル(四角)を非表示
    if event.xdata == None or event.ydata == None:
        rect.set_xy((np.nan, np.nan))
        plt.draw()
        return

    # Rectangleのxyは左下の座標なので、マウスを中心に四角を描けるよう計算
    x = event.xdata - width / 2
    y = event.ydata - height / 2
    cur.set_xy((x, y))
    cur.set_width(width)
    cur.set_height(height)

    # タイトルに現在の縦横サイズを表示
    ax.set_title('width = {}, height = {}'.format(round(width, 3), round(height, 3)))

    # グラフを更新
    plt.draw()


def onclick(event):
    global width, height
    # 右クリックで縦横交換
    if event.button == 3:
        width, height = height, width
        return

    # 範囲外クリック無効
    if event.xdata == None or event.ydata == None:
        return

    # Rectangleのxyは左下の座標なので、マウスを中心に四角を描けるよう計算
    x = event.xdata - width / 2
    y = event.ydata - height / 2
    new_rect = Rectangle(xy=(x, y), width=width, height=height, ec='b', fill=False)
    ax.add_patch(new_rect)
    plt.draw()

def scroll(event):
    global width, zoom, height
    width *= zoom**(event.step)
    height *= zoom**(event.step)

fig.canvas.mpl_connect('button_press_event', onclick)
fig.canvas.mpl_connect('motion_notify_event', motion)
fig.canvas.mpl_connect('scroll_event', scroll)
plt.show()
出力は以下です。
おわりに
今回は縦横どちらも1.5倍ずつ拡大、縮小しましたが、縦か横別々に倍率変更できるようにしたり、四角ではなくて丸にしたりなどいろいろ変更して遊んでみてください。