はじめに
以前の記事でmatplotlibでライフゲームを作成してみたりしました。
その際は初期値はランダムでアニメーションを作るだけでした。
今回は前回紹介したボタン等を使って初期値をユーザーが自由に作れるように改造してGUIアプリっぽいものを作成したいと思います。
matplotlibのみで作っていきます。
実装
準備
グラフやボタンの配置を行います。
# モジュールのインポート
import numpy as np
import matplotlib.pyplot as plt
import matplotlib.widgets as wg


def btn_click(event):
    global now_processing
    if now_processing:
        now_processing = 0
        btn.label.set_text('Start')
        plt.draw()
        return
    else:
        now_processing = 1
        btn.label.set_text('Stop')
        plt.draw()
        return


board = np.random.randint(0, 2, (25, 25))
now_processing = 0
fig, ax = plt.subplots(2, 1, gridspec_kw=dict(width_ratios=[1], height_ratios=[8, 1]))
img = ax[0].imshow(board, vmin=0, vmax=1)
line1 = ax[0].hlines(y=np.arange(0, 25)+0.5, xmin=np.full(25, 0)-0.5,
                    xmax=np.full(25, 25)-0.5, color="black", linewidth=1)
line2 = ax[0].vlines(x=np.arange(0, 25)+0.5, ymin=np.full(25, 0)-0.5,
                    ymax=np.full(25, 25)-0.5, color="black", linewidth=1)
btn = wg.Button(ax[1], 'Start', color='#f8e58c', hovercolor='#f8b500')
btn.on_clicked(btn_click)
plt.show()

アプリの仕様
以下のような動作をするアプリを作成します
- スタートボタンを押すとライフゲームの世代を進める
- ストップボタンを押すとその時の世代で固定
- 世代が固定されているときは、盤面の任意のセルを押すとそのセルの生死を入れ替える
それでは順番に実装していきましょう
ボタンでライフゲームの実行、停止を操作する
ライフゲームの実装は以前やったので割愛します。
過去記事を参照ください。
ボタンでの動作の実装は下記のようにします。
- 各セルの現在の状態はグローバル変数boardに格納
- ボタンの状態にかかわらずアニメーションで一定時間ごとに現在のboardを表示
- ボタンを一回押すごとにグローバル変数のnow_processingを0, 1でトグルさせる
- アニメーション更新タイミングで、now_processing=1ならライフゲームのルールにのっとりboardを1世代進めて表示
- アニメーション更新タイミングで、now_processing=0ならboardをそのまま表示
# モジュールのインポート
import numpy as np
import matplotlib.pyplot as plt
import matplotlib.widgets as wg
from matplotlib.animation import FuncAnimation


def btn_click(event):
    global now_processing
    if now_processing:
        now_processing = 0
        btn.label.set_text('Start')
        plt.draw()
        return
    else:
        now_processing = 1
        btn.label.set_text('Stop')
        plt.draw()
        return


def count_cell(i, j):
    '''i列j行目のセルの周りの生きたセルの数をカウントする関数
    入力:
        i, j: int 対象セルの番地
    出力:
        cnt: int 対象セルの周りの生きたセルの数
    '''
    cnt = 0
    for ii, jj in area:
        indh = i + ii
        indw = j + jj
        if indh < 0 or indh >= board.shape[0]:
            continue
        elif indw < 0 or indw >= board.shape[1]:
            continue
        else:
            if board[indh, indw]:
                cnt += 1
            else:
                continue
    return cnt


def evaluate(cnt, now):
    '''セルの周りの生きているセルの数をもとに、次世代での状態を決定する関数
    入力:
        cnt: int 対象セルの周りの生きているセルの数
        now: int 対象セルの現世代での状態
    出力:
        new: int 対象セルの次世代での状態
    '''
    new = 0
    if now:
        if cnt == 2 or cnt == 3:
            new = 1
    else:
        if cnt == 3:
            new = 1
    return new


def update():
    '''盤面の世代を更新する関数
    '''
    global board
    new_board = np.zeros(board.shape)
    for i in range(board.shape[0]):
        for j in range(board.shape[1]):
            now = board[i, j]
            cnt = count_cell(i, j)
            new = evaluate(cnt, now)
            new_board[i, j] = new
    board = new_board
    return


# グラフ更新関数
def update_anim(dt):
    global board
    if now_processing:
        update()
    img.set_data(board)
    return img, line1, line2,


board = np.random.randint(0, 2, (25, 25))
area = [(-1, -1), (-1, 0), (-1, 1), (0, -1), (0, 1), (1, -1), (1, 0), (1, 1)]
now_processing = 0
fig, ax = plt.subplots(2, 1, gridspec_kw=dict(width_ratios=[1], height_ratios=[8, 1]))
img = ax[0].imshow(board, vmin=0, vmax=1)
line1 = ax[0].hlines(y=np.arange(0, 25)+0.5, xmin=np.full(25, 0)-0.5,
                    xmax=np.full(25, 25)-0.5, color="black", linewidth=1)
line2 = ax[0].vlines(x=np.arange(0, 25)+0.5, ymin=np.full(25, 0)-0.5,
                    ymax=np.full(25, 25)-0.5, color="black", linewidth=1)
btn = wg.Button(ax[1], 'Start', color='#f8e58c', hovercolor='#f8b500')
btn.on_clicked(btn_click)
ani = FuncAnimation(fig, update_anim, interval=50, blit=True)
plt.show()
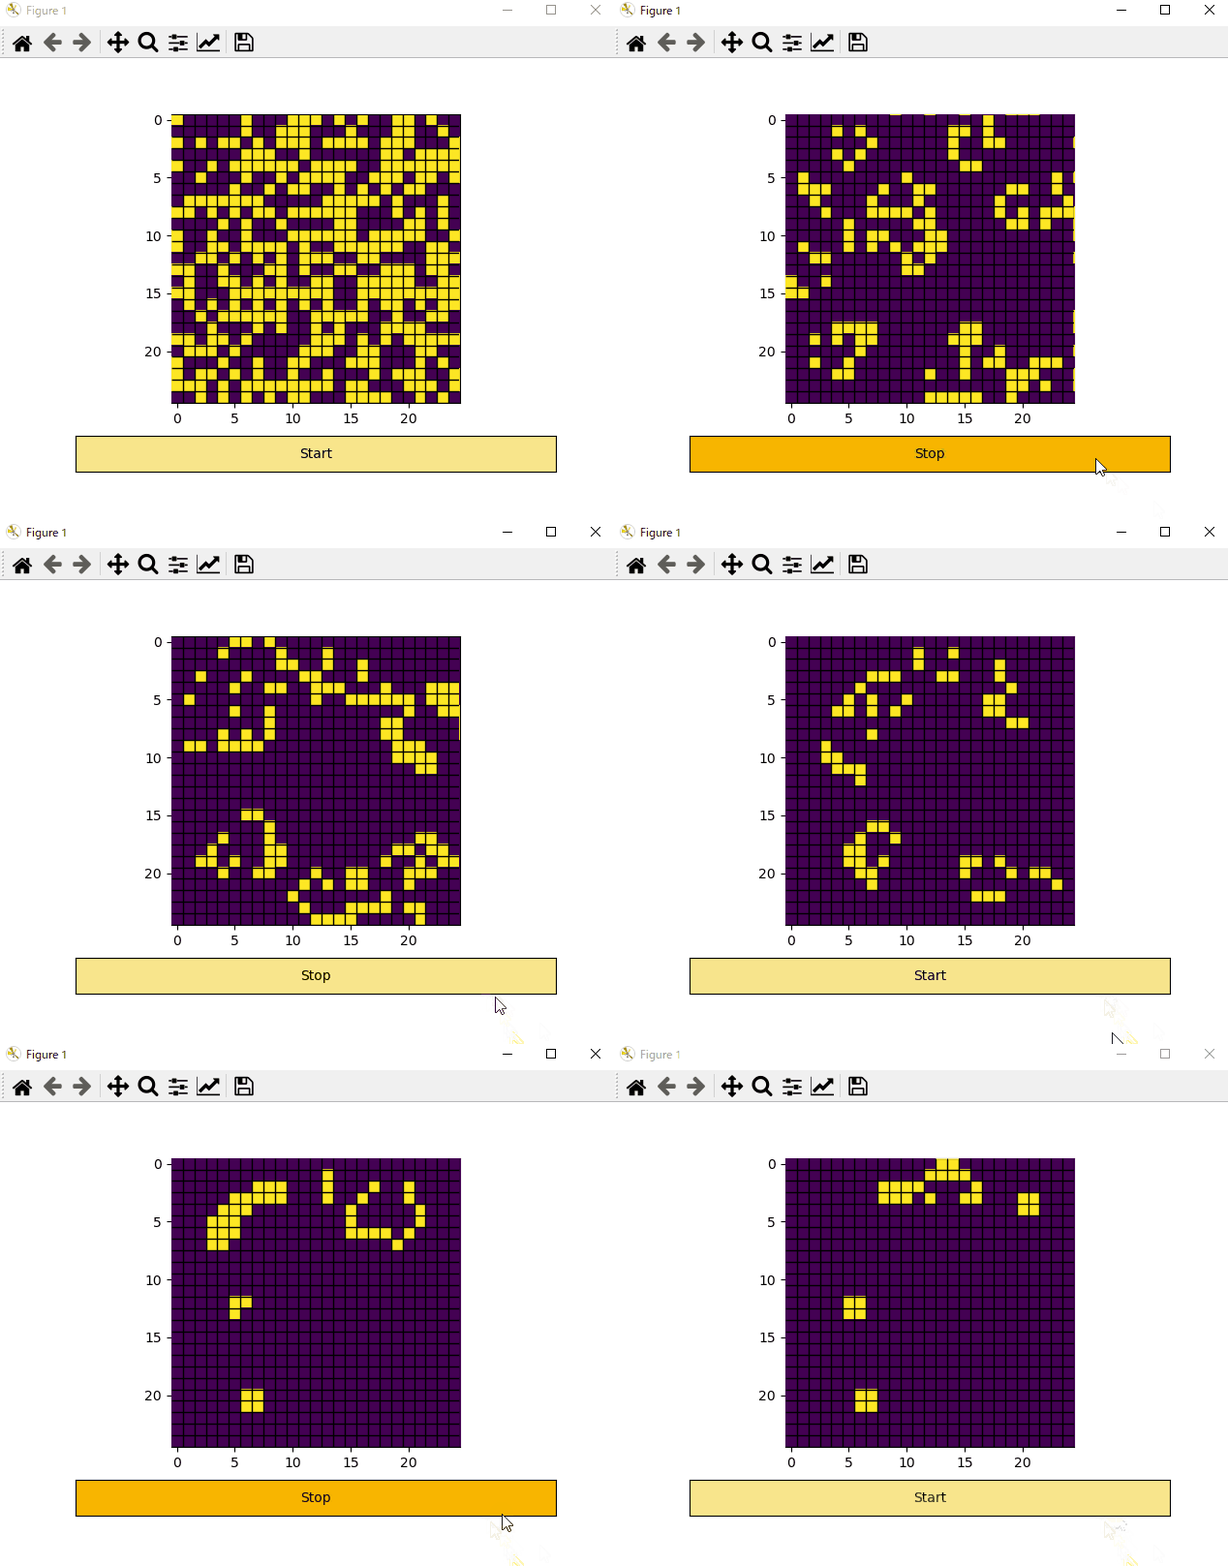
実行結果は下記のとおりです。

初期値をユーザーに入力させる
最後にユーザが自由にセルの状態を書き換えられるようにしたいと思います。
以下の関数をグラフに紐づけるだけです。
def onclick_graph(event):
    global board, now_processing
    if event.xdata and event.ydata and now_processing == 0 and event.inaxes == ax[0]:
        x = int(event.xdata + 0.5)
        y = int(event.ydata + 0.5)
        if board[y, x] == 0:
            board[y, x] = 1
        else:
            board[y, x] = 0
        img.set_data(board)
        plt.draw()
    else:
        return

# figureとクリックイベントを紐づけ
fig.canvas.mpl_connect('button_press_event', onclick_graph)
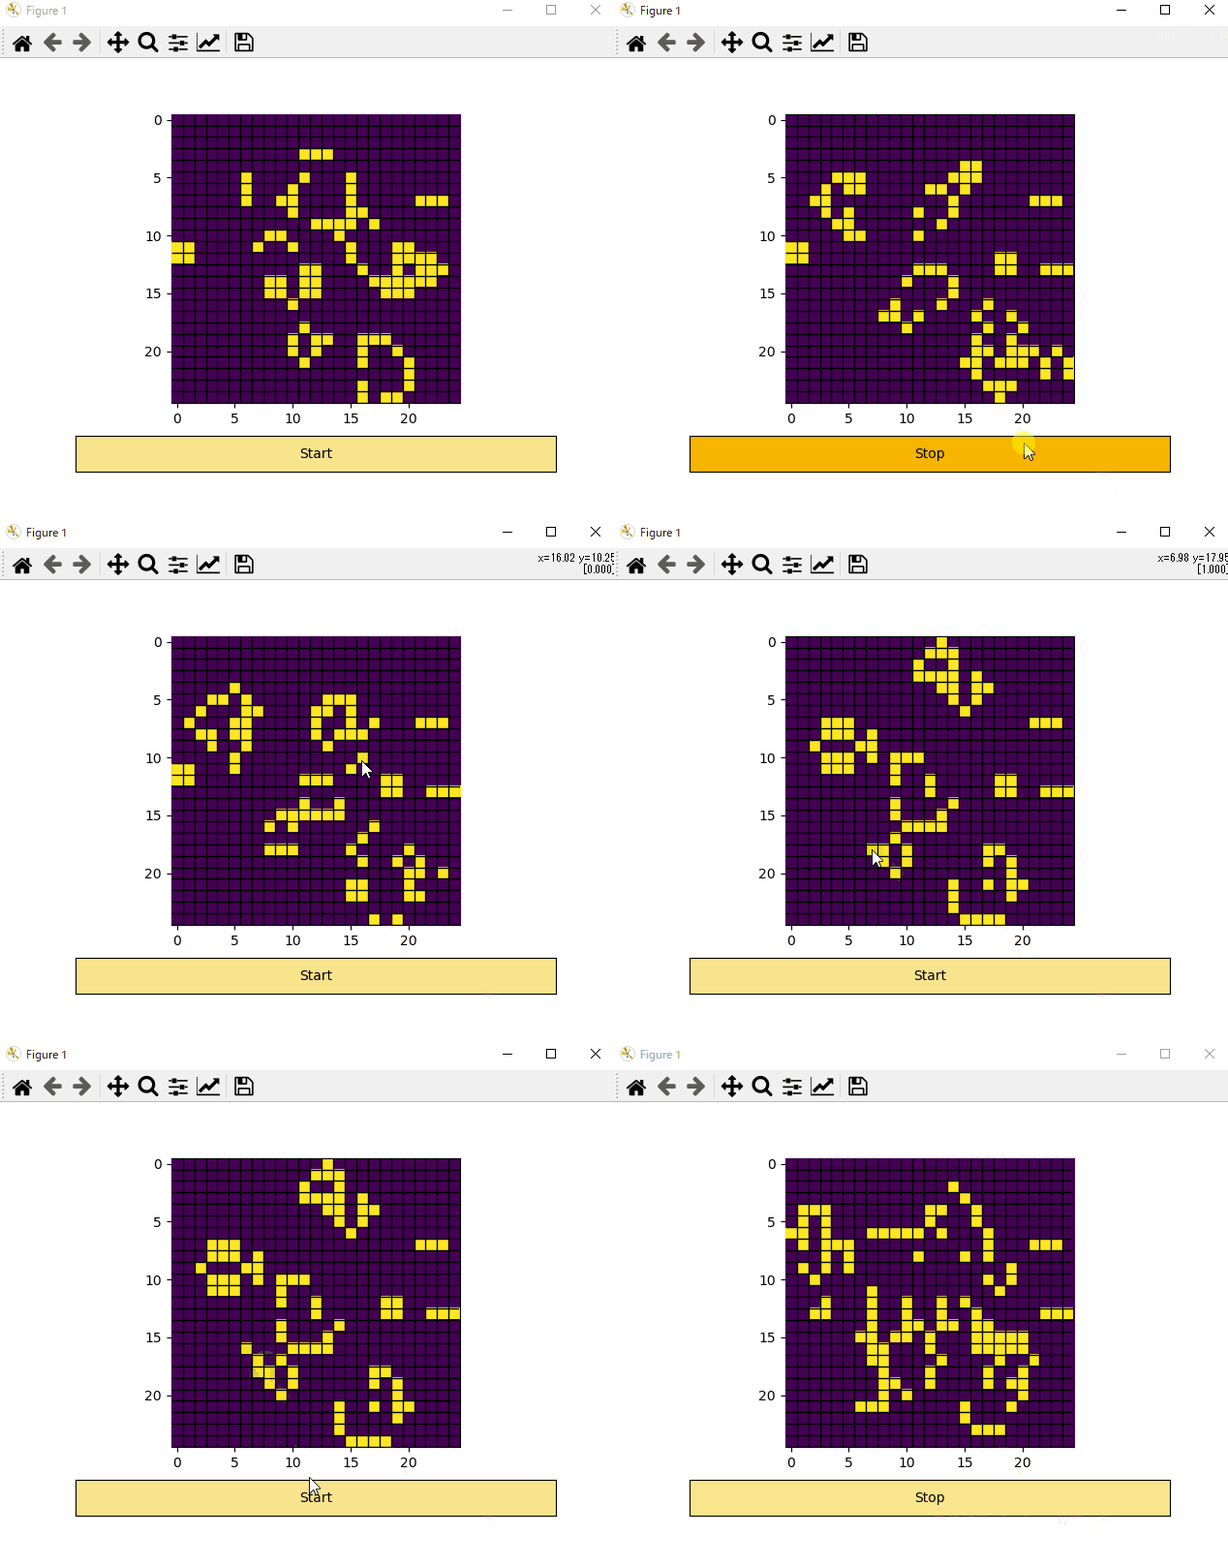
実行結果はこちら。

全コード
最後に全コードを載せておきます。
# モジュールのインポート
import numpy as np
import matplotlib.pyplot as plt
import matplotlib.widgets as wg
from matplotlib.animation import FuncAnimation


def btn_click(event):
    global now_processing
    if now_processing:
        now_processing = 0
        btn.label.set_text('Start')
        plt.draw()
        return
    else:
        now_processing = 1
        btn.label.set_text('Stop')
        plt.draw()
        return


def onclick_graph(event):
    global board, now_processing
    if event.xdata and event.ydata and now_processing == 0 and event.inaxes == ax[0]:
        x = int(event.xdata + 0.5)
        y = int(event.ydata + 0.5)
        if board[y, x] == 0:
            board[y, x] = 1
        else:
            board[y, x] = 0
        img.set_data(board)
        plt.draw()
    else:
        return


def count_cell(i, j):
    '''i列j行目のセルの周りの生きたセルの数をカウントする関数
    入力:
        i, j: int 対象セルの番地
    出力:
        cnt: int 対象セルの周りの生きたセルの数
    '''
    cnt = 0
    for ii, jj in area:
        indh = i + ii
        indw = j + jj
        if indh < 0 or indh >= board.shape[0]:
            continue
        elif indw < 0 or indw >= board.shape[1]:
            continue
        else:
            if board[indh, indw]:
                cnt += 1
            else:
                continue
    return cnt


def evaluate(cnt, now):
    '''セルの周りの生きているセルの数をもとに、次世代での状態を決定する関数
    入力:
        cnt: int 対象セルの周りの生きているセルの数
        now: int 対象セルの現世代での状態
    出力:
        new: int 対象セルの次世代での状態
    '''
    new = 0
    if now:
        if cnt == 2 or cnt == 3:
            new = 1
    else:
        if cnt == 3:
            new = 1
    return new


def update():
    '''盤面の世代を更新する関数
    '''
    global board
    new_board = np.zeros(board.shape)
    for i in range(board.shape[0]):
        for j in range(board.shape[1]):
            now = board[i, j]
            cnt = count_cell(i, j)
            new = evaluate(cnt, now)
            new_board[i, j] = new
    board = new_board
    return


# グラフ更新関数
def update_anim(dt):
    global board
    if now_processing:
        update()
    img.set_data(board)
    return img, line1, line2,


board = np.zeros((25, 25))
board = np.random.randint(0, 2, (25, 25))
area = [(-1, -1), (-1, 0), (-1, 1), (0, -1), (0, 1), (1, -1), (1, 0), (1, 1)]
now_processing = 0
fig, ax = plt.subplots(2, 1, gridspec_kw=dict(width_ratios=[1], height_ratios=[8, 1]))
img = ax[0].imshow(board, vmin=0, vmax=1)
line1 = ax[0].hlines(y=np.arange(0, 25)+0.5, xmin=np.full(25, 0)-0.5,
                    xmax=np.full(25, 25)-0.5, color="black", linewidth=1)
line2 = ax[0].vlines(x=np.arange(0, 25)+0.5, ymin=np.full(25, 0)-0.5,
                    ymax=np.full(25, 25)-0.5, color="black", linewidth=1)
btn = wg.Button(ax[1], 'Start', color='#f8e58c', hovercolor='#f8b500')
btn.on_clicked(btn_click)
fig.canvas.mpl_connect('button_press_event', onclick_graph)
ani = FuncAnimation(fig, update_anim, interval=50, blit=True)
plt.show()
おわりに
matplotlibでも割と簡単にボタンとか作成できますので(配置はめんどくさいですが)、グラフ操作する程度の簡単なアプリであればmatplotlibだけでも十分かとおもいます。
リンク